No products in the cart.

Introduction
Our post shows that ESG scores can capture different information to Quality scores and hence investing in ESG is not simply investing in Quality. This point has been a topic of recent debate with some studies instead showing high overlap.
Our view is the outcome of any study may depend on the data provider used. Consequently, when making ESG integration decisions, the effect of using different data providers needs to be explored so those decisions can be made as robust as possible to the variability inherent in ESG data.
Setting the scene
We proxy Quality by using a profitability score expressed as gross income over total assets, normalised to a percentile rank score from 0-100. The equity data is powered by FactSet.
The ESG score is the headline score measured from 0-100. The ESG ratings are supplied by OWL Analytics.
We focus on US stocks from 31st Dec 2009 to 30th Sep 2021. Our original universe consists of around 1,250-1,350 medium and large cap stocks depending on the time point. Every quarter we use a sub-set of the universe with a minimum 20-day average trading volume over $1 million and with both an ESG score and a profitability score. The resultant number of stocks ranges from around 750-1,000.
Method 1: Information Coefficient
Many stock selection methods are based on ranking scores, for example profitability scores or ESG scores. Under such a selection method, if the order of stocks based on ranking high to low or good to bad is the same for profitability as it is for ESG, there is no difference in information between the two scores. The correlation of the rank order, otherwise known as the information coefficient, captures this independence well. An information coefficient of 1 means the order is the same. An information coefficient of -1 means the order is reversed. An information coefficient of 0 means the order is independent.
The monthly information coefficient between OWLS’s ESG score and the profitability score is displayed in Plot 1. The average value is 6.3%.
Method 2: ESG curve
If there is a positive signal correlation between say profitability and ESG, a portfolio made up of top-profitability stocks should have a blended ESG score higher than a portfolio of low-profitability stocks.
We can evaluate this over time by building equal weight, quarterly rebalancing portfolios of the top 25% of stocks by profitability, a ‘Top-Profitability’ portfolio and similarly for the bottom 25% of stocks, a ‘Bottom-Profitability’ portfolio. For each Profitability portfolio, we can calculate the weighted average ESG score of the portfolio over time – an ‘ESG Curve’.
If the Top-Profitability portfolio’s ESG Curve is higher than the Bottom-Profitability portfolio’s ESG Curve, then there is a positive signal correlation. The wider the gap, the stronger the correlation.
The ESG curves for the two Profitability portfolios are displayed in Plot 2.
Relationship between the plots.
Over time one can observe that when the information coefficient is positive, the Top-Profitability portfolio’s ESG score lies above the Bottom-Profitability portfolio’s ESG score. And for the few times the information coefficient is negative, for example in the second half of 2018, the reverse is true. When the information coefficient is the strongest in Feb 2014, the gap in ESG curves is the greatest, but only a gap of ~4 points, i.e., from ~48 to ~52.
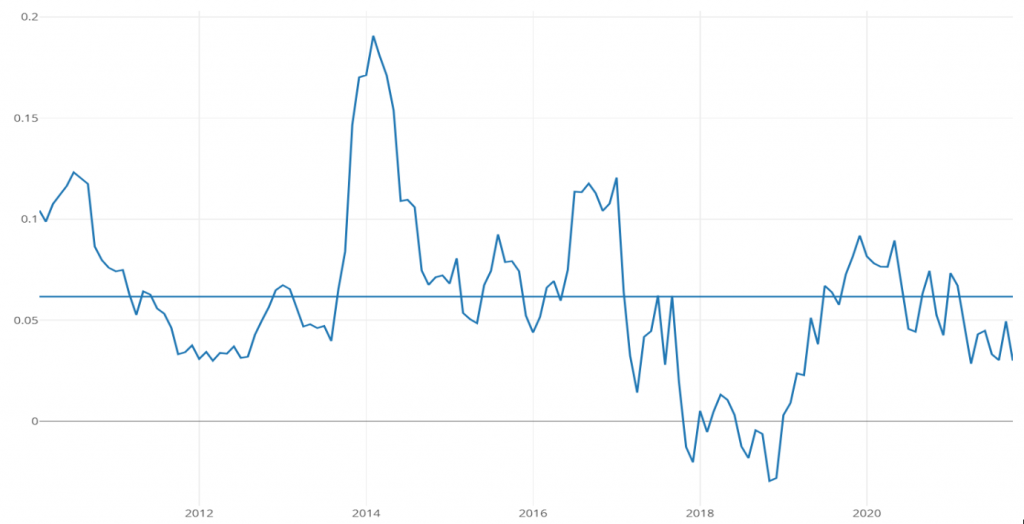
Plot 1: Monthly information coefficient between OWL’s ESG score and the profitability score
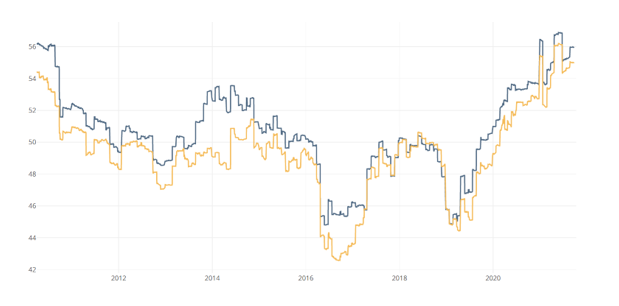
Plot 2: ESG scores over time for the Top Profitability (blue) and Bottom Profitability (yellow) portfolios
Top and Bottom – ESG portfolios
To understand whether a 4% spread of portfolio ESG scores is significant, it can help to observe what the widest spreads could typically be. A good indication is if we build Top ESG and Bottom ESG portfolios on 25% quantiles and compare their ESG scores.
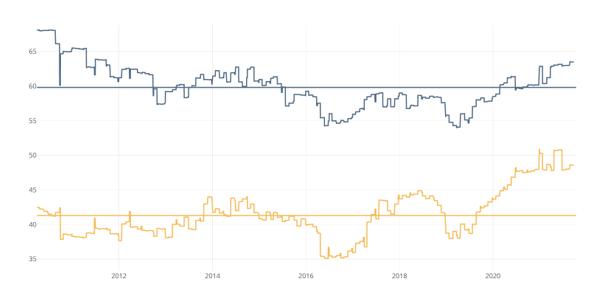
Plot 3: ESG scores over time and period average for the Top ESG (blue) and Bottom ESG (yellow) portfolios
We come to an average of 59 vs 41, a gap of 18. The widest gap is around 27. Thus 4 is not very significant.
Conclusion
For the US universe we have looked at, there does not appear to be a strong relationship between OWL Analytics’ ESG scores and profitability as a proxy for Quality. Using information coefficient and stylised Top & Bottom portfolios can illustrate this in an intuitive way and provide a more visual complement to regression techniques.
We note that other research has shown strong relationships between ESG and Quality. Our findings are not contradictory to this other analysis. It is simply that different data providers develop their scores in different ways, hence different providers scores will have different relationships to markets.
When considering an investment thesis and integrating ESG through a particular type of data (in our current example ratings), one must recognise the impact can be different depending on the ESG data provider used. The consequence is that when making ESG integration decisions, the effect of the integration needs to be examined over several data providers so that fundamental integration decisions can be made as robust as possible to the variability inherent in ESG data.
As a practical example in the context of our study, if there was consensus amongst data providers (based on numerical analysis) that ESG scores and Quality scores were highly correlated, an ESG focused investor should just use ESG scores, and a quality investor should just use Quality scores. Instead, if there was no such consensus and on aggregate the correlation was low, combining ESG and Quality into a single factor score could make sense and add value to investment returns while at the same time obtaining a better ESG portfolio.
Join TISAtech and become part of the largest network driving innovation throughout the industry

©2022 TISAtech Ltd. All rights reserved. Registered in England and Wales No 12699835. Our VAT registration number is 354 6138 94. Registered office: Dakota House, First Floor, 25 Falcon Court, Preston Farm Business Park, Stockton-on-Tees, TS18 3TX